SolarWarden: What We Built During a Three-Week Hackathon
At the end of my hackathon post, I wrote about submitting the last line of code, closing the laptop, and sleeping for a very long time.
I never said what we were actually rushing to submit.
It was SolarWarden.
SolarWarden was our project for the Google ADK Hackathon. A copilot for solar-farm operators: find the inverter that looks wrong, pull the relevant data, read the alarm context, and give someone a report before they spend half a day clicking through charts.
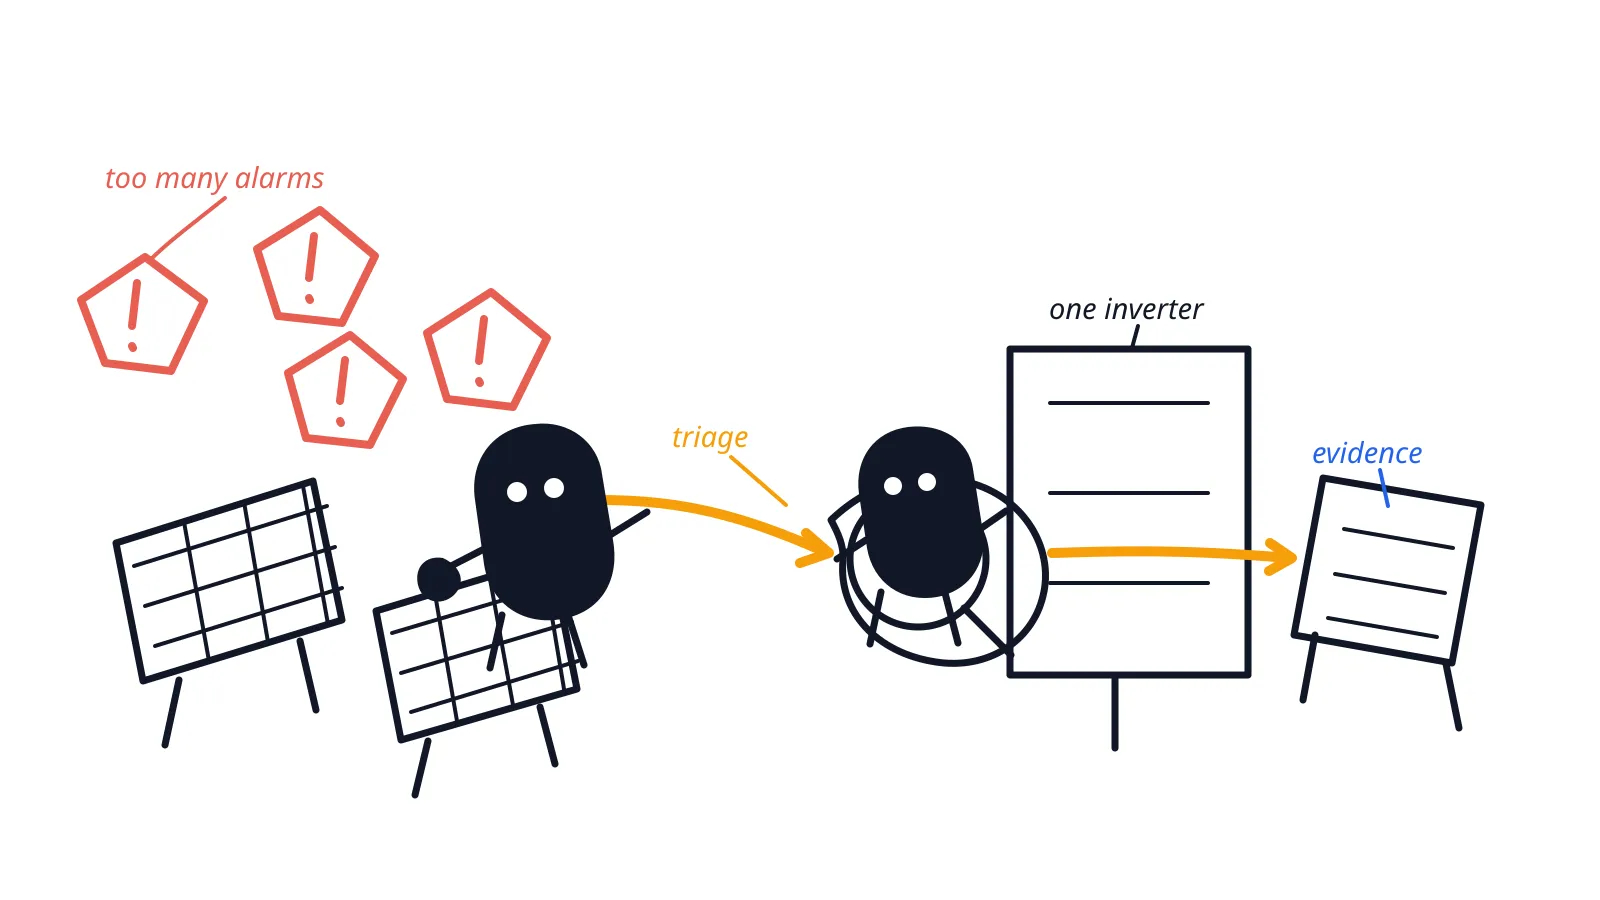
The part we wanted the product to do: turn a loud alarm storm into something an operator can actually investigate.
Solar farms do not fail in one neat place. There are string panels, inverters, transformers, then the grid. Every layer has logs. Every layer can complain. When something goes wrong, the control centre gets a flood of alarms and somebody still has to work out which one matters.
The project brief was full of ugly numbers:
- 12–18 alarm events an hour during fault conditions.
- 72% of maintenance teams reporting alarm fatigue from false positives.
- US$2,500–7,000 lost for each hour a 50MW farm is down.
- Three to five technician hours for a manual diagnosis, before work orders, site evidence, and reporting.
- Delayed fault detection contributing to 28% of energy loss.
That is where we started. Help the operator get past alarm flooding, manual root-cause analysis, and the downtime that follows when everyone is still trying to work out what happened.
What we built
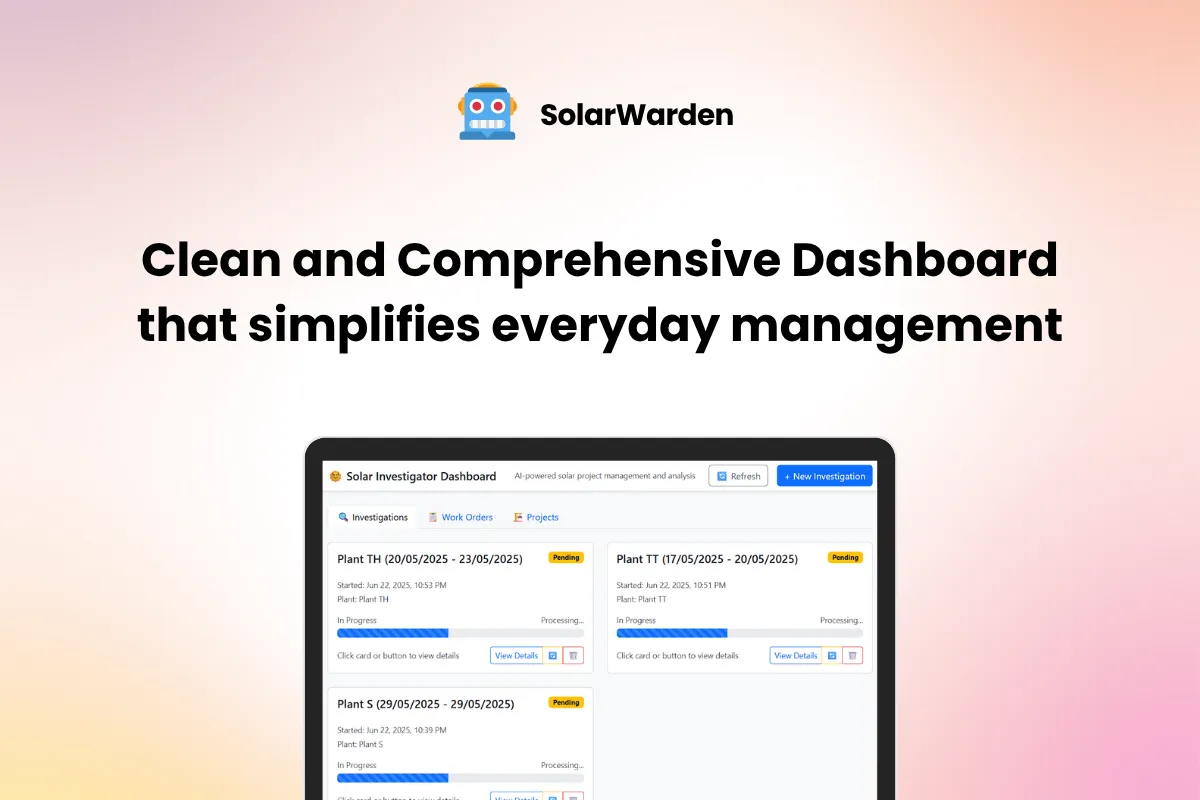
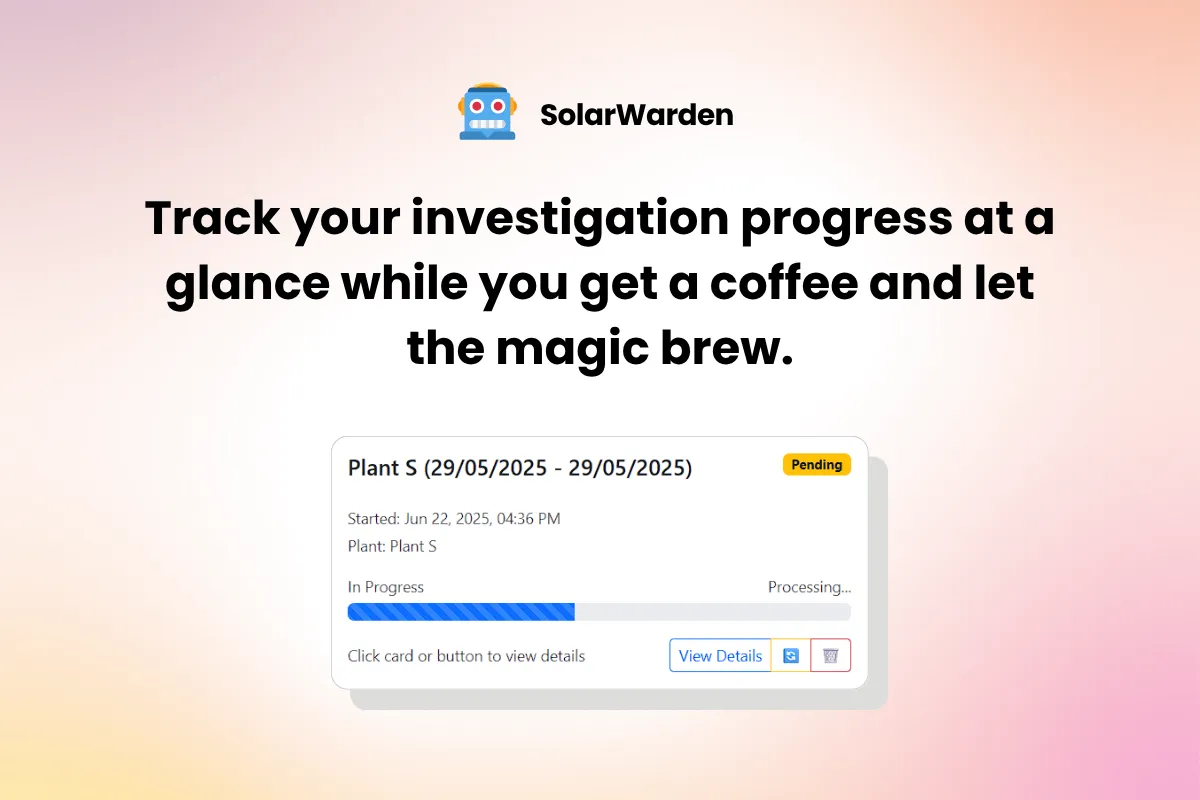
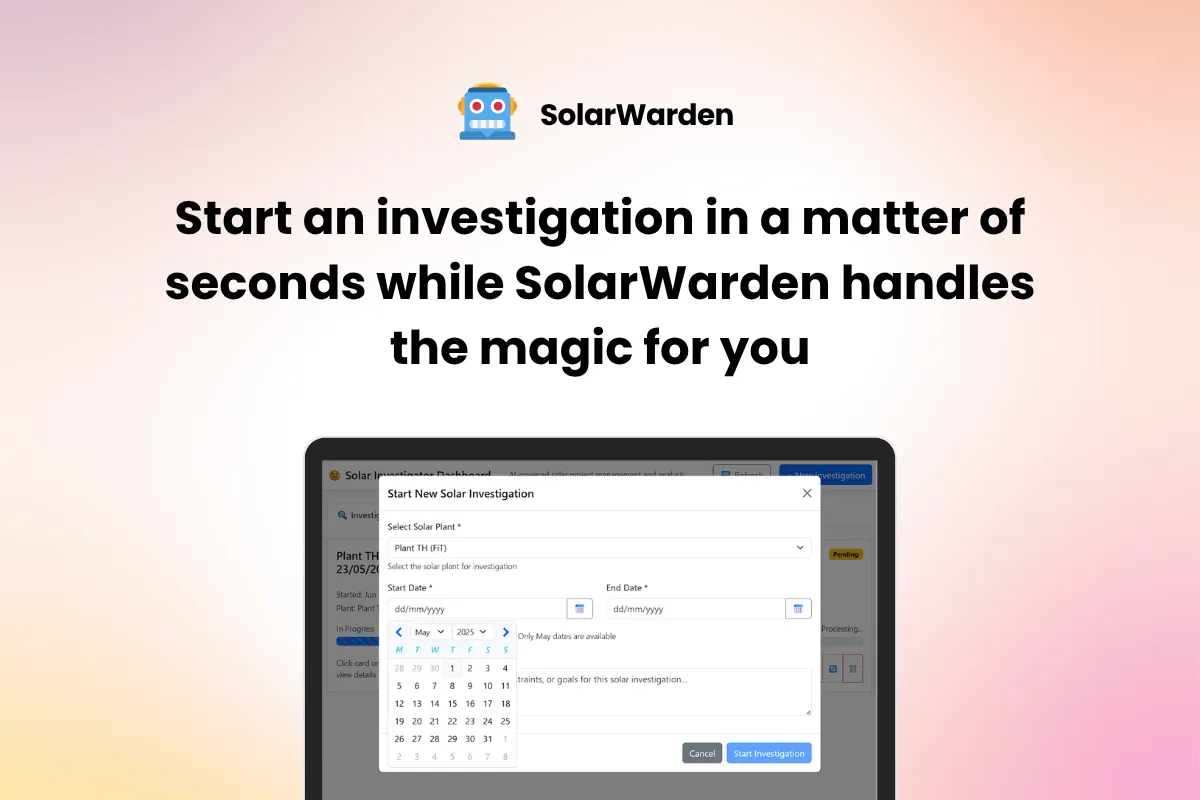
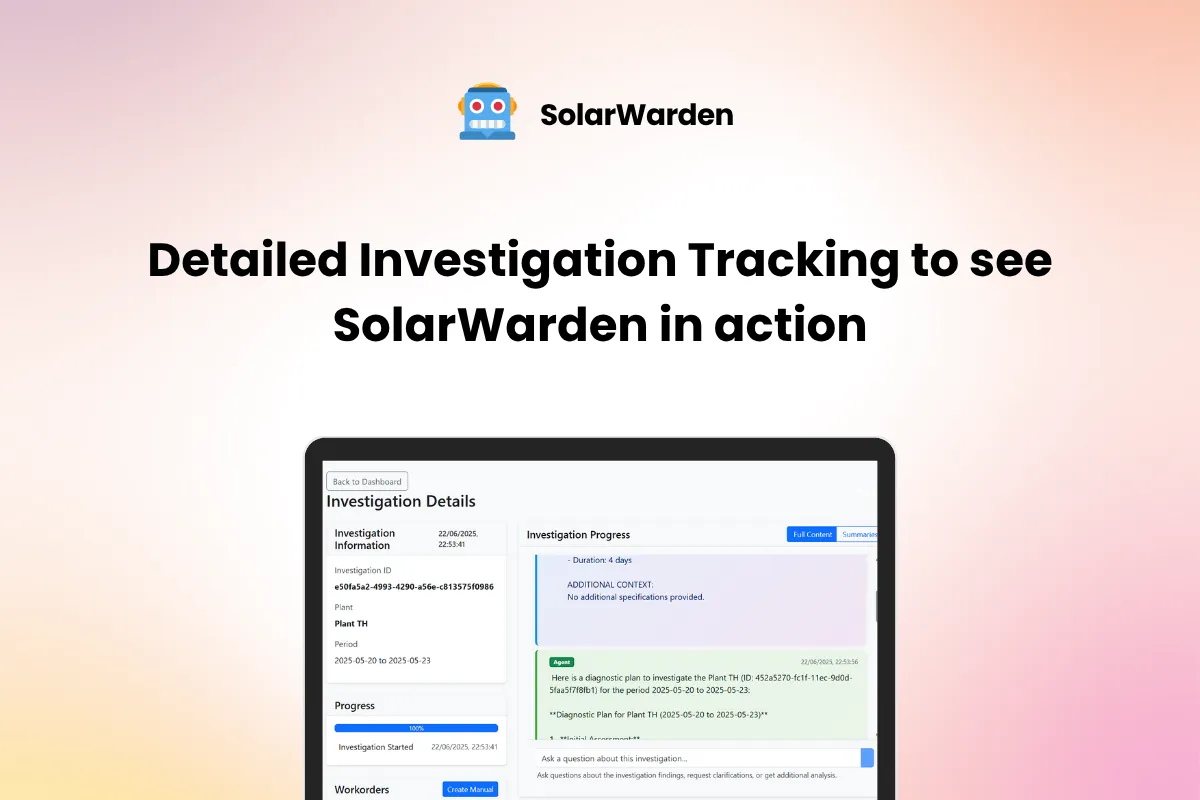
At the front, SolarWarden looked like a dashboard. An operator could manage the farm, ask about an investigation, and get something more useful than a raw alarm code.
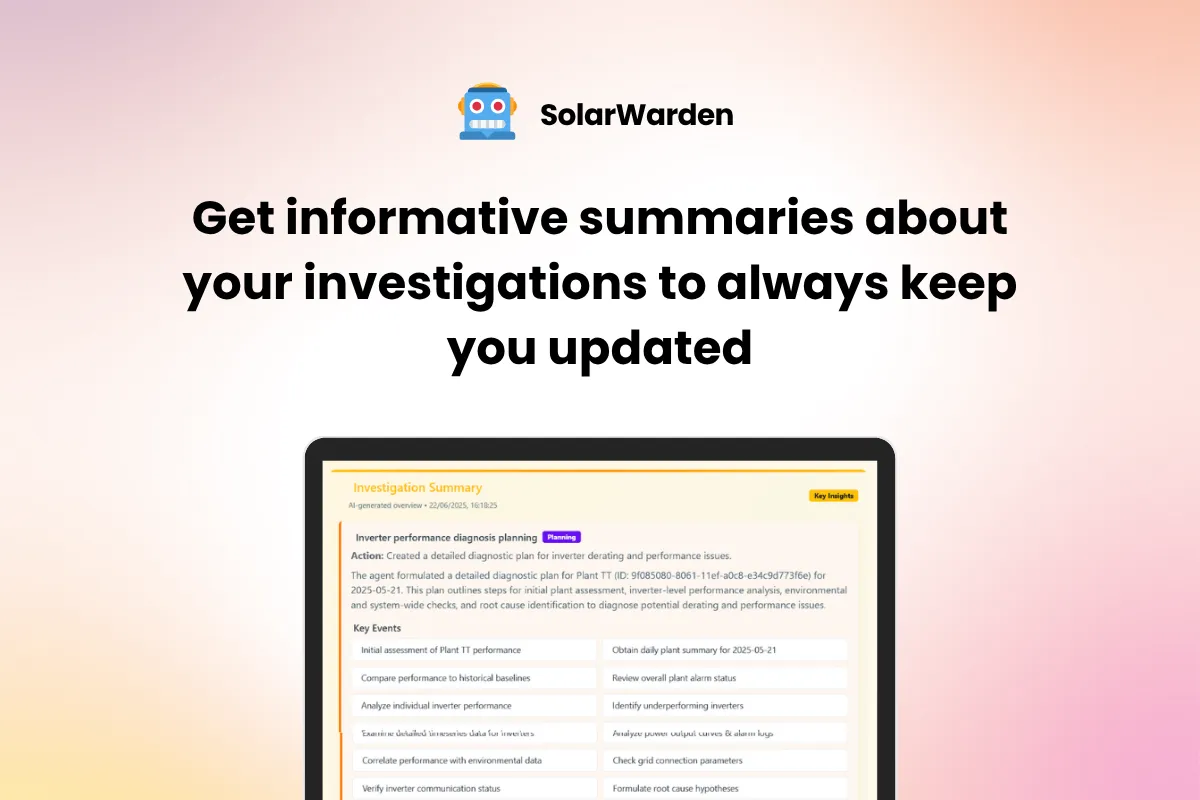
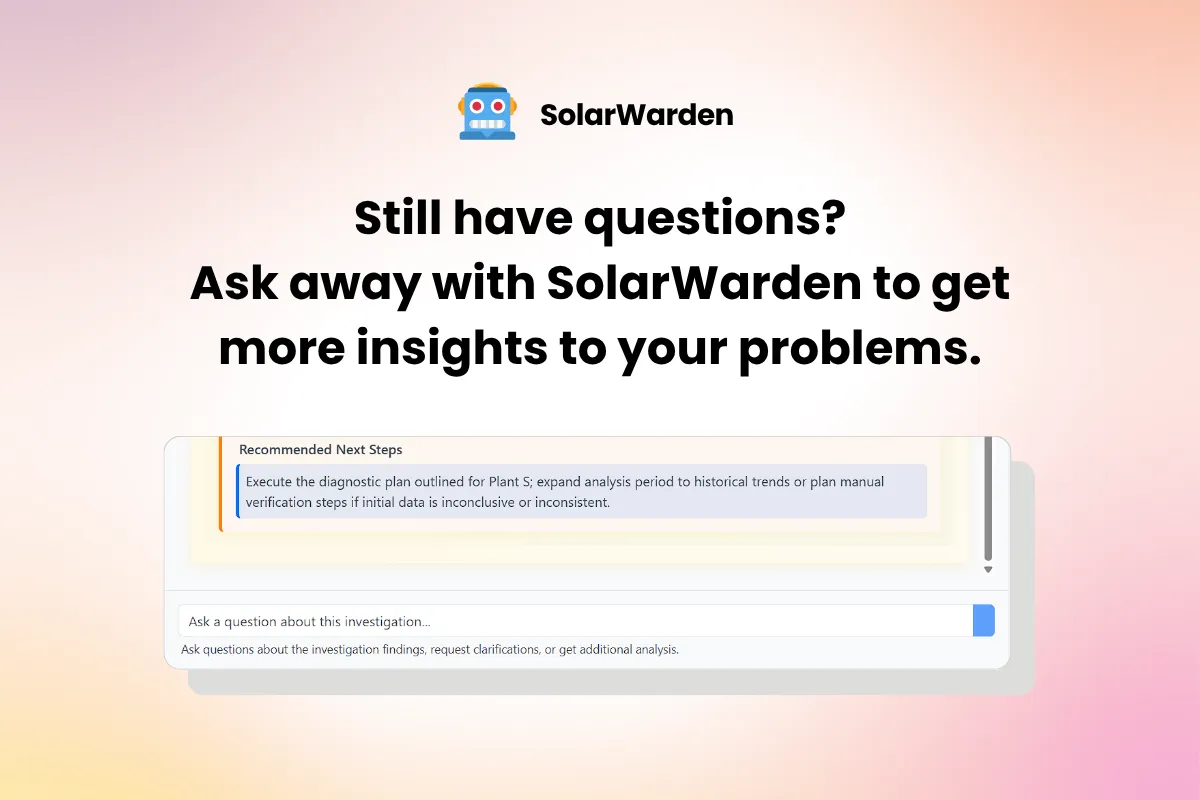
The screenshots below are the presentation material from the original Devpost submission. They make more sense as one small deck than scattered through the technical write-up.
Presentation material
1 / 7
Swipe, use the arrows, or press ← →
The actual pipeline
The UI was the easy bit. The actual project was a Google ADK graph called problem_finder.
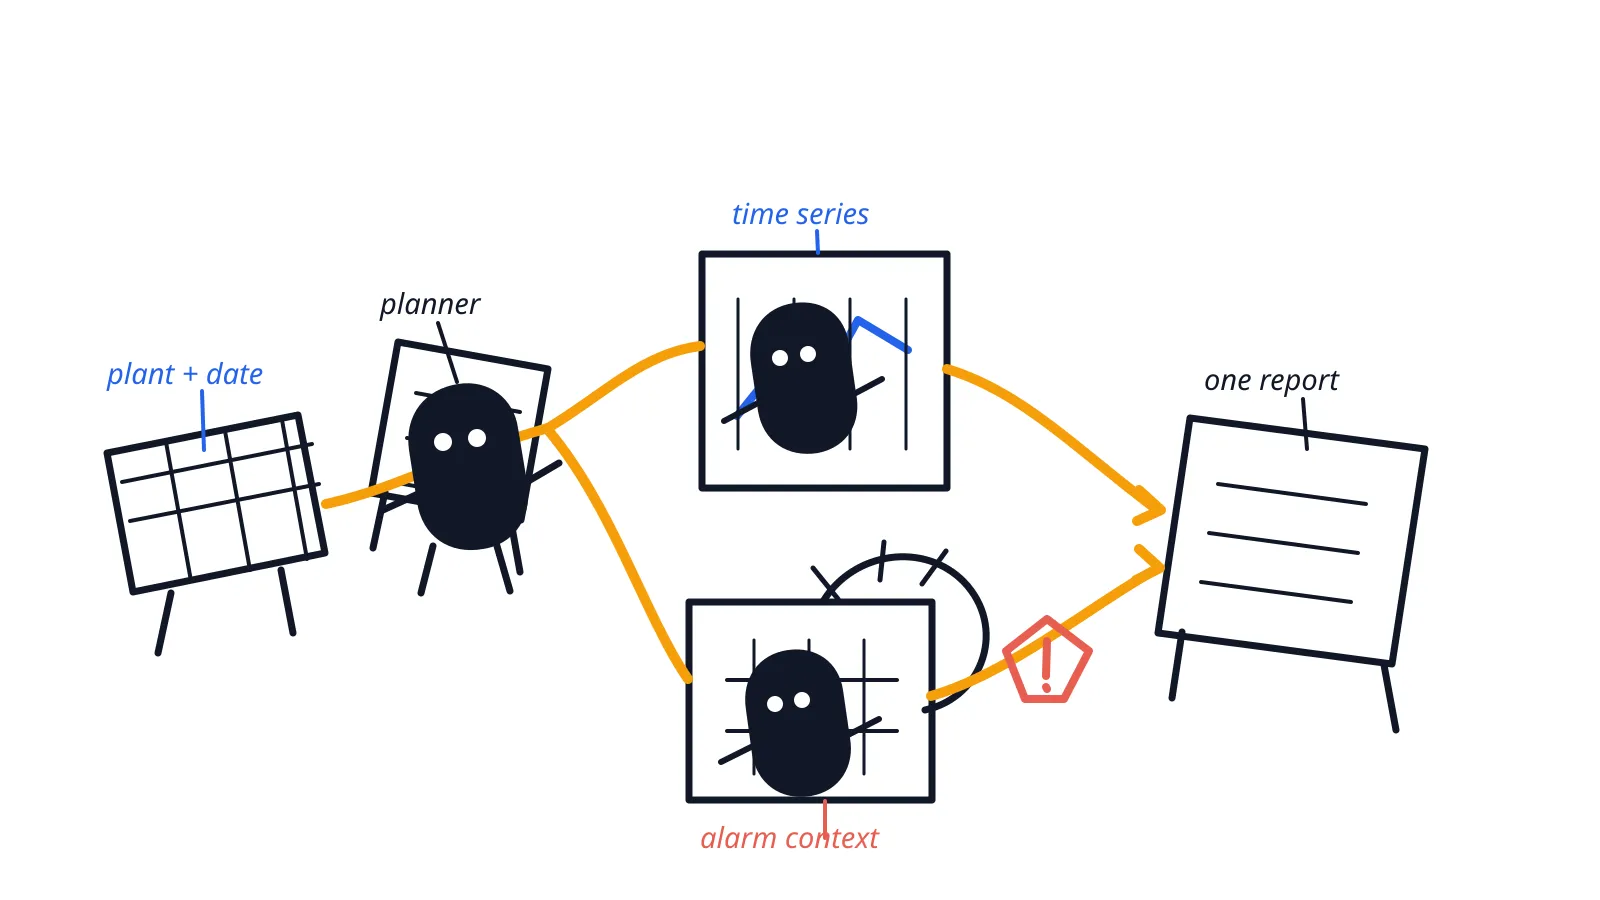
The mental model behind the graph: give each investigation path a narrow job, then bring the evidence back together.
planner_agent
  → daily_pr_agent
  → parallel_pipeline
      ├─ detailed_plant_timeseries_agent
      └─ alarm_researcher
           → alarm_research_agent
           → detailed_inverter_performance_agent
  → aggregator_agent
The root was a SequentialAgent. It did not just throw one giant prompt at Gemini and hope for a diagnosis.
The planner first used MCP tools to list available plants and inverters. Once it knew what the operator was looking at, it kept the selected inverter IDs and capacity information in ADK session state. The daily-PR agent then pulled the plant summary. After that, the work split in two:
- The timeseries agent retrieved five-minute plant data, filtered it, and kept the suspicious rows in state.
- The alarm branch first researched alarms, then passed the result to the inverter-performance agent to check the device trend.
Those two branches ran in parallel. The aggregator only ran after both came back, then wrote the final comprehensive report.
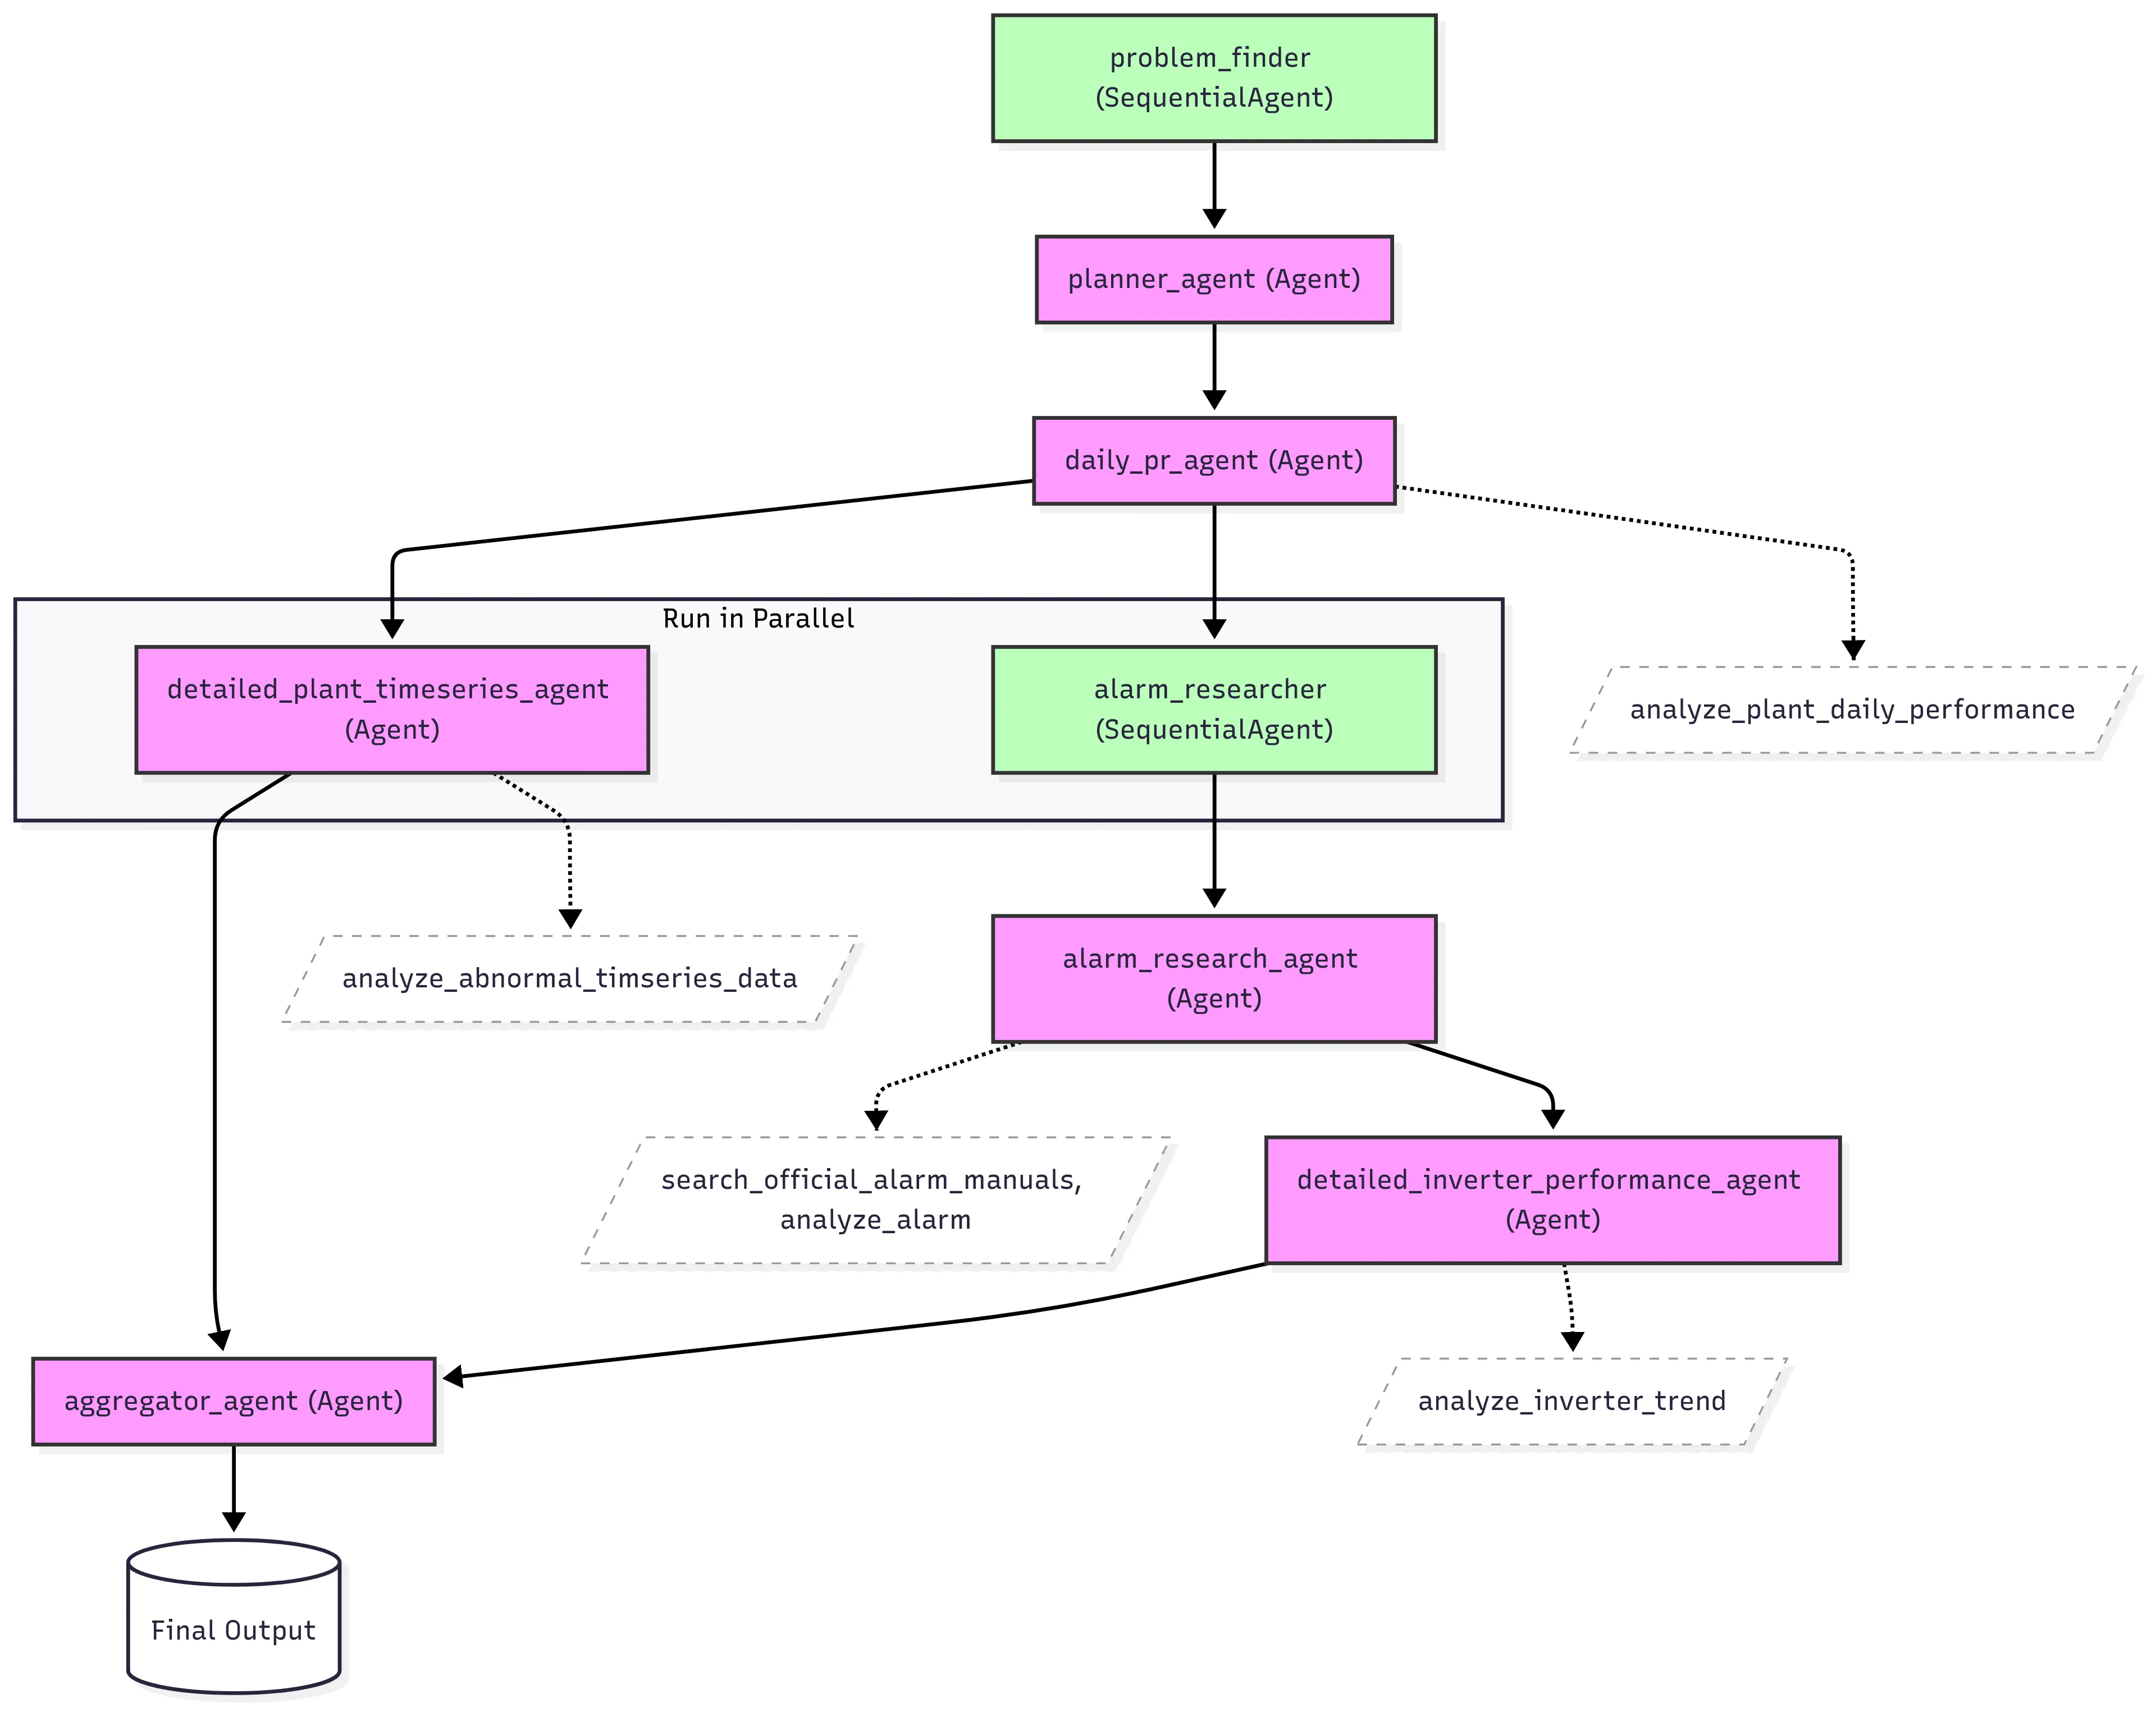
The actual orchestration we used: plan, check daily performance, split the timeseries and alarm paths, then aggregate.
The toolbox was also concrete. It could compare daily inverter performance, pull all alarms, get daily plant summaries, fetch detailed plant timeseries, list inverter alarms, list plants and inverters, and track one inverter over time.
That is the important bit. The agents were not chatting about solar farms from memory. They had narrow jobs and a data boundary.
The RAG part
The RAG mistake was even dumber. At first, we threw every operational manual into one knowledge store. The Alarm Trace Assistant would retrieve a technically related manual that was completely wrong for the equipment in front of it.
So we split the manuals into separate knowledge bases. The alarm agent first identified the device model, listed the available corpora, chose a target corpus, then queried it. It asked Vertex AI RAG for the top three matching passages and kept a vector-distance threshold so it could return the source name, source URI, text, and score instead of a confident made-up answer.
Small change. Much less nonsense.
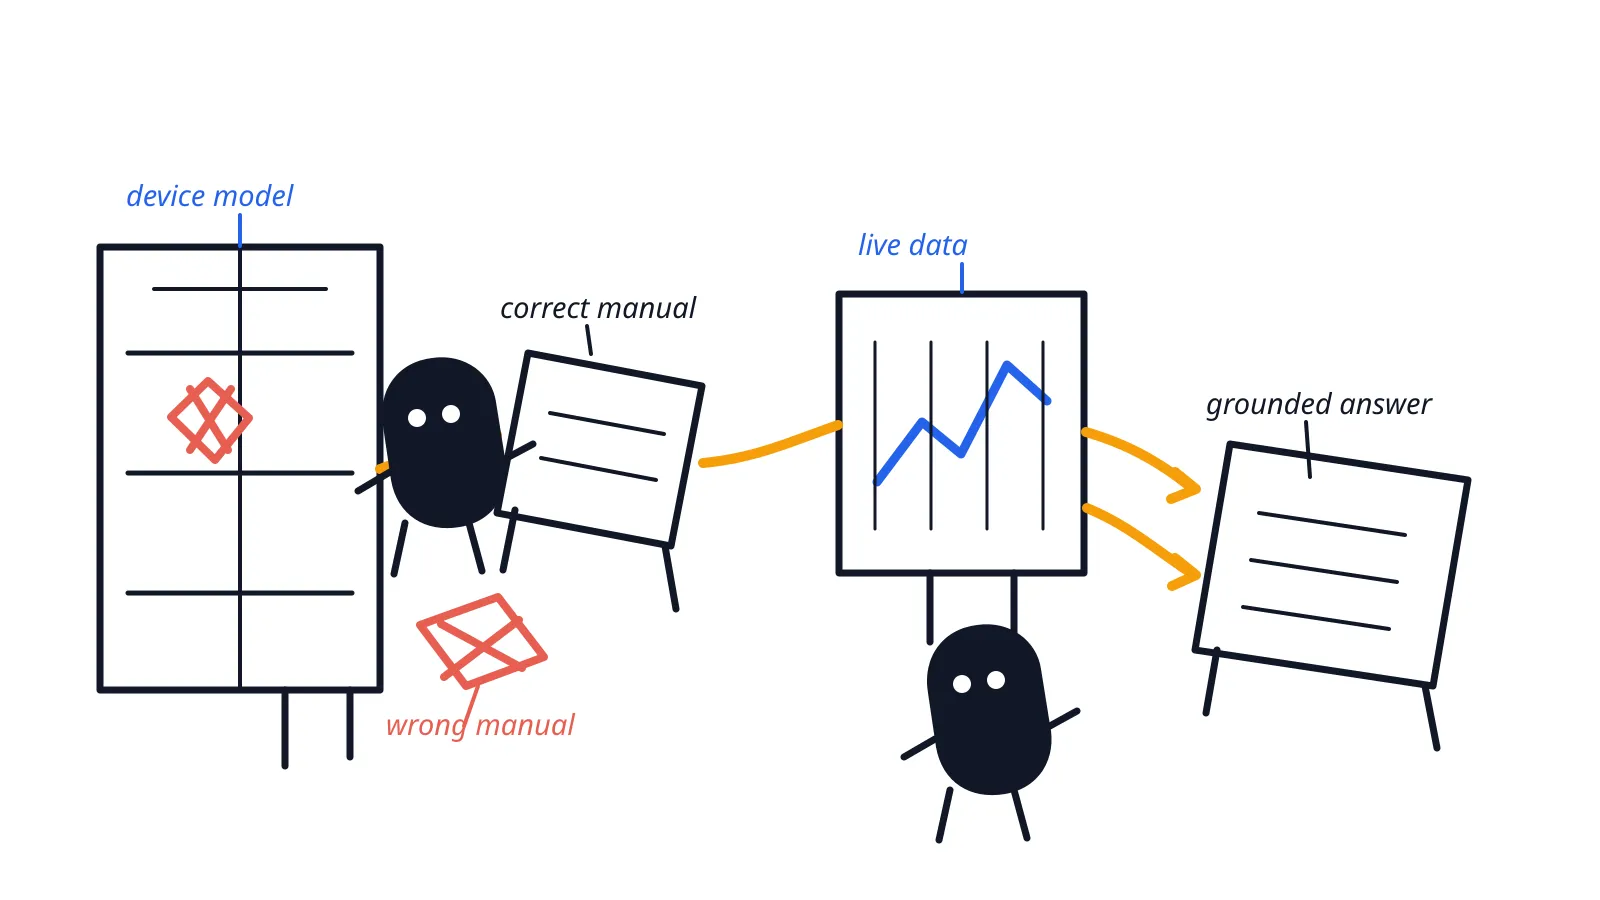
The manual only became useful after it matched the actual equipment and sat beside the current data.
The alarm agent could still call back into the data tools. A manual alone does not explain a fault. It needed the alarm history, plant summary, inverter alarms, and time-series data beside it.
The parts that got annoying
The first investigation flow was very simple:
Agent → fetch data through MCP → agent → analysisThen the agent realised it needed another scope. Another data fetch. Another round of analysis.
It was a very expensive way to take a long walk.
We used sequential and parallel-agent patterns so independent analysis could happen together. The work became smaller hand-offs instead of one agent dragging the entire conversation around with it.
Reports had the same problem. A few days of five-minute interval data can produce a ridiculous amount of reasoning. Cut it too hard and the next agent loses the details it needs. Keep everything and it gets handed a wall of prose.
We added an after_agent_callback to every meaningful agent. It ran a separate summarizer model and forced the output into JSON:
- the main theme;
- the action taken and its type;
- a first-person description capped at 300 characters;
- the next step; and
- concise event messages capped at 50 characters each.
Each summary was timestamped and appended to ui_summary in the ADK session. That gave the frontend something it could render while the long-running investigation was still moving.
How the UI stayed live
An investigation started with a plant ID, start date, end date, and optional notes. We limited the date range to five days because this was already enough five-minute data to make a mess.
FastAPI created an ADK DatabaseSessionService session, then started the problem_finder runner in the background. That session carried the investigation metadata, every agent output, suspicious rows, the final report, and the UI summaries.
The frontend did not wait for the final report. It opened an SSE stream. The backend emitted status changes, tool calls, tool results, partial text, and completion events as the runner moved through the graph. We deliberately used SSE instead of WebSockets to keep the streaming path simpler.
There was also a separate follow-up Q&A agent. It received the completed investigation report as context and answered operator questions without rerunning the whole pipeline.
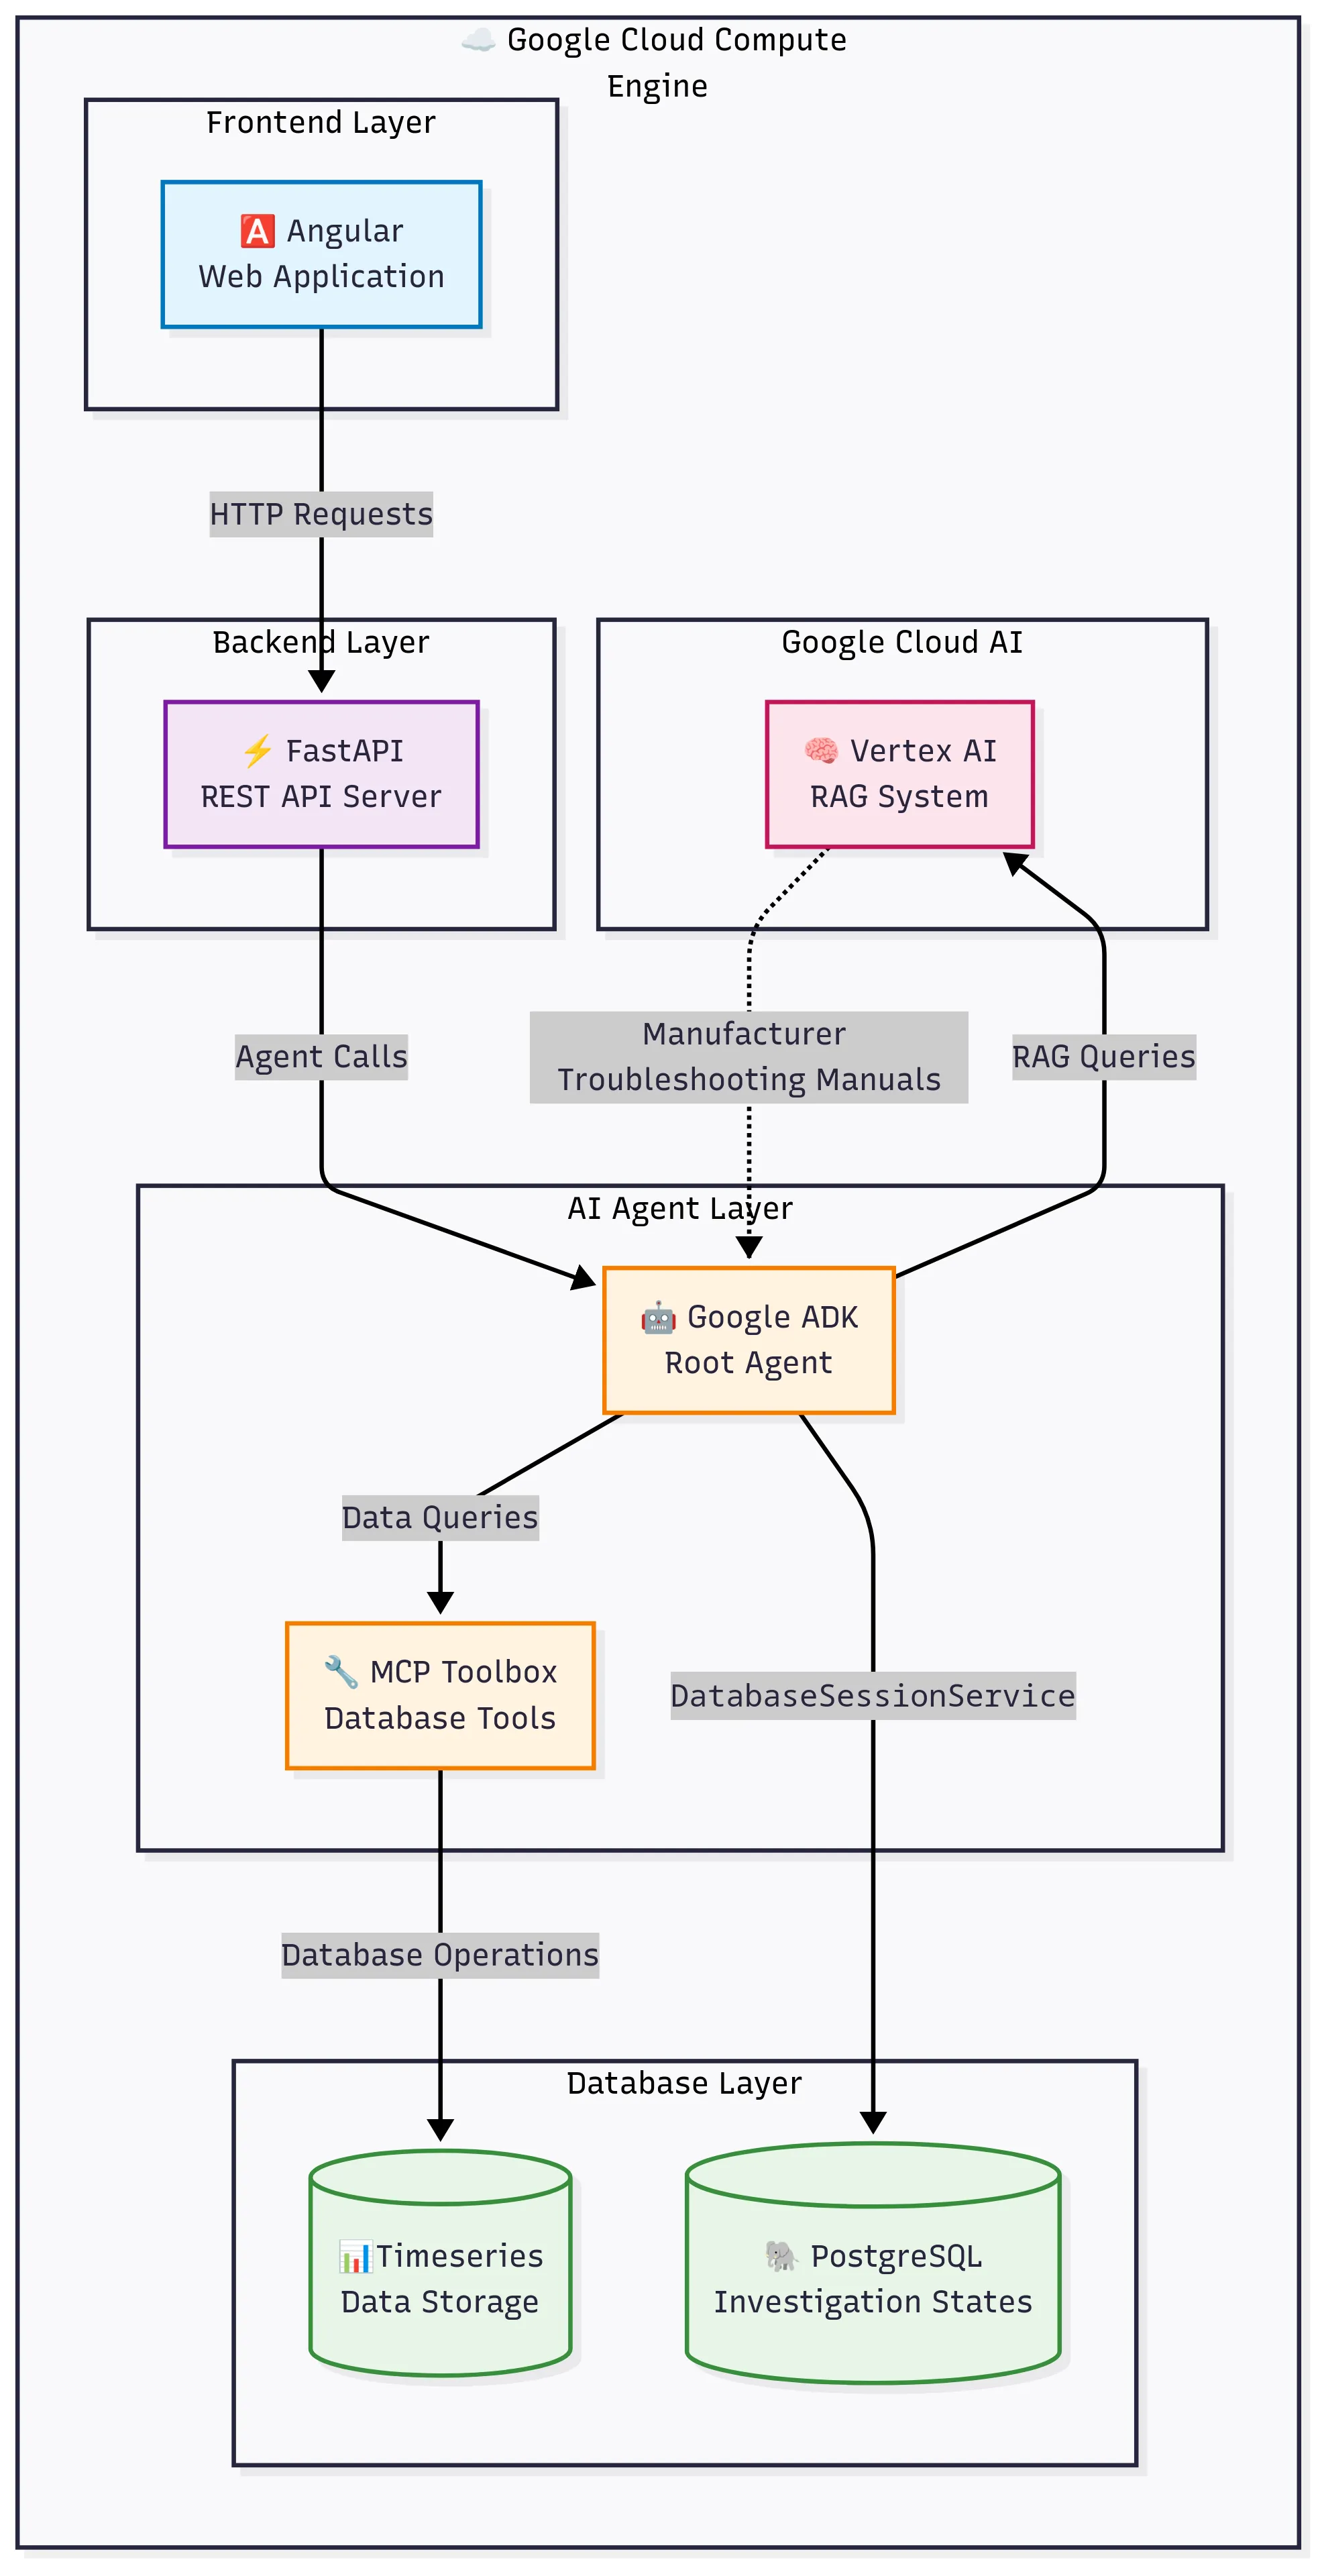
Angular sent requests to FastAPI; the ADK root agent used MCP database tools and Vertex AI RAG; investigation state sat in PostgreSQL.
The stack was Angular, Docker, FastAPI, Google ADK, Google Cloud, Google Vertex AI RAG Engine, MCP Toolbox for Databases, and PostgreSQL.
What we wanted to build next
The demo ended before we got to the rest of the workflow:
- A human-in-the-loop
workorder_agentto create and assign work orders from investigation findings. - Google Tasks MCP integration for contractor assignment and progress tracking.
- Gemini-based image and video analysis for evidence returned by on-site contractors.
There was already an @workorder-agent path in the prototype, but the actual dispatch integration was still scaffolded and simulated. That part needed real contractor ownership and real approval rules before it could become more than a good demo.
I built it with Marcus Ng and Jayden Yong. Marcus was studying Computer Science (AI) at the University of Malaya; Jayden was studying Software Engineering there. I was the one with an M.Sc. in Computer Science from SJTU and too many tabs open.
We submitted it to the Agent Development Kit Hackathon with Google Cloud. The code is on GitHub, and the original Devpost submission is still there.
Then we submitted it, closed the laptops, and slept.